Stage 15 — Performance Testing Deep Dive
Goal: answer “will it hold up under real load?” with evidence. Learn the test types, the metrics that matter, a repeatable methodology, and the tools (k6, JMeter, Gatling, Locust) — plus how to read results and find bottlenecks. I’ve load-tested payment-critical systems at Mastercard and telecom-scale traffic at Grameenphone, and shipped a k6 suite for FUR4; this is the field-tested version.
1. Why performance testing is its own discipline
Functional testing asks “does it work for one user?” Performance testing asks “does it still work for 10,000 — and how does it fail when it finally does?” A feature that’s correct but takes 12 seconds under load is a broken feature. Slow is the new down.
2. The types of performance testing
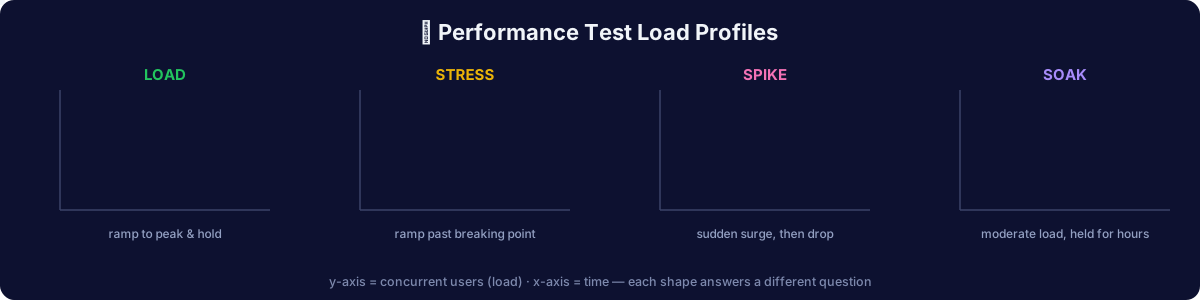
| Type | Question it answers | Load profile |
|---|---|---|
| Load | Does it meet targets at expected peak? | Ramp to expected peak, hold, observe |
| Stress | Where does it break, and how gracefully? | Ramp past capacity until it fails |
| Spike | Can it survive a sudden surge (flash sale, viral post)? | Instant jump to high load, then drop |
| Soak / Endurance | Does it degrade over time (memory leaks, connection exhaustion)? | Moderate load held for hours |
| Scalability | Does adding resources actually help? | Increase load + resources, measure gain |
| Volume | Does it handle large data (huge tables, big payloads)? | Big datasets, not just many users |
3. The metrics that actually matter
Never report averages alone — averages hide the pain. Use percentiles.
| Metric | What it means | Why it matters |
|---|---|---|
| Latency (response time) | Time per request | Report p50 / p95 / p99, not just mean. p95 = “95% of users saw this or better” |
| Throughput | Requests/sec (RPS) or transactions/sec | The system’s actual capacity |
| Error rate | % of failed requests under load | A fast system that 500s at scale has failed |
| Concurrency / VUs | Virtual users active at once | The load level you’re simulating |
| Saturation | CPU, memory, DB connections, I/O | Where the bottleneck is (needs server monitoring) |
The percentile trap: an average of 200ms can hide a p99 of 8s — meaning 1 in 100 requests is agony. At scale, p99 is someone’s every experience. Always look at the tail.
4. A repeatable methodology
- Define goals in numbers. “p95 < 500ms and error rate < 1% at 2,000 concurrent users.” Vague goals = useless tests. Get these from product/SLAs.
- Model realistic load. Real users don’t hammer one endpoint — they follow journeys with think-time (pauses). Base your mix on real analytics.
- Use a production-like environment. Testing on a laptop tells you nothing. Match prod topology, data volume, and config as closely as possible.
- Baseline first. Measure at low load so you can see what degrades.
- Ramp gradually, watch metrics live, and note the load level where latency/errors start climbing — that’s your knee.
- Monitor the server, not just the client. The load tool shows symptoms (slow responses); server metrics (CPU, memory, DB) show the cause.
- Analyze & isolate the bottleneck, retest after each fix. One variable at a time.
- Report with percentiles, graphs, the breaking point, and a clear verdict.
5. The tools
| Tool | Language / style | Best for |
|---|---|---|
| k6 | JavaScript scripts, CLI-first | Modern, developer-friendly, CI-native. My default — see my FUR4 k6 suite |
| JMeter | GUI + XML | The veteran; huge protocol support, big ecosystem, common in job listings |
| Gatling | Scala/Java DSL | High performance, great HTML reports |
| Locust | Python | Pythonic, easy to script complex user behavior |
| Artillery | YAML/JS | Simple, cloud + serverless friendly |
A k6 test looks like this
import http from 'k6/http';
import { check, sleep } from 'k6';

export const options = {
  stages: [
    { duration: '2m', target: 200 },   // ramp up to 200 VUs
    { duration: '5m', target: 200 },   // hold (this is the "load" phase)
    { duration: '2m', target: 0 },     // ramp down
  ],
  thresholds: {
    http_req_duration: ['p(95)<500'],  // 95% under 500ms — fail the build otherwise
    http_req_failed:   ['rate<0.01'],  // <1% errors
  },
};

export default function () {
  const res = http.get('https://staging.example.com/api/products');
  check(res, { 'status 200': (r) => r.status === 200 });
  sleep(1);   // think-time — model real users, don't hammer
}
Run: k6 run script.js. Those thresholds turn a load test into a pass/fail gate you can drop into CI.
6. Reading results & finding bottlenecks
Where the problem usually hides, in rough order of frequency:
- Database — missing indexes, N+1 queries, connection-pool exhaustion, lock contention (the #1 culprit)
- Application — inefficient code, synchronous blocking calls, no caching
- Network / payload — huge responses, chatty APIs, no compression
- Infrastructure — undersized instances, no autoscaling, single points of failure
- Third parties — a slow payment or shipping API dragging your p99
Pair the load tool with observability — Grafana + Prometheus/InfluxDB dashboards (k6 streams to these natively) — so you watch latency, throughput, and server saturation on one screen while the test runs.
7. Performance in CI/CD
Bake a lightweight load test (a few minutes, modest VUs) into your pipeline with thresholds, so a performance regression fails the build the same way a functional bug does. Run the heavy, long-duration soak/stress tests on a schedule (nightly/weekly) against a prod-like environment.
8. Reliability & chaos (the advanced edge)
Beyond load: chaos engineering — deliberately inject failures (kill a node, add network latency, saturate CPU) to verify the system degrades gracefully and recovers. I ran this on payment-critical systems at Mastercard, where the tolerance for silent failure was effectively zero. Tools: Chaos Mesh, Gremlin, or simple fault injection via a proxy (Stage 5). It pairs naturally with soak testing.
9. Learn it (free, hands-on)
| Resource | What it gives |
|---|---|
| k6 documentation | Excellent official docs + examples — start here |
| Grafana k6 Learn | Ready-to-run test recipes |
| JMeter User Manual | The canonical JMeter reference |
| my FUR4 k6 suite | A real load-testing suite you can read |
| Practice targets | k6 test.k6.io, restful-booker — safe to load-test |
⚠️ Ethics: only load-test systems you own or are authorized to test. Hammering a site you don’t control is an attack, not a test.
10. Portfolio project
A k6 (or JMeter) suite against a public test API:
- Load, stress, and spike scenarios with realistic think-time and a journey mix
- Thresholds that pass/fail the run, wired into GitHub Actions
- A short report: percentile latencies, throughput, the breaking point, and one bottleneck hypothesis with evidence
✅ Exercise
Using k6 against test.k6.io:
- Write a load test: ramp to 50 VUs, hold 3 min, with a p95 < 800ms threshold and think-time
- Turn it into a spike test (jump straight to 300 VUs) — does the error rate climb? At what point?
- Report p50/p95/p99, throughput, and error rate — and state whether it passed your goal and why
Next → revisit the full roadmap or the Sources library